


2020 is the best year for the e-commerce market in more than a decade. The growth of eCommerce has undergone rapid changes, and online eCommerce platforms have captured most of them. In general, this year is also the most successful year for sellers and brands that conduct transactions through these eCommerce platforms.
According to the market overview and hot trends of cross-border eCommerce platforms in 2020 released by Marketplace Pulse recently, we can know the following important data (partially listed):

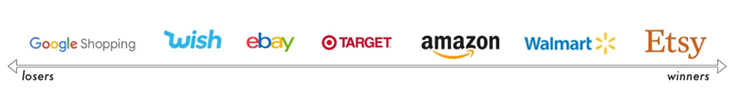
Overview of the 7 mainstream cross-border eCommerce platforms
With the vigorous development of e-commerce during the epidemic, to some extent, Amazon, Etsy, Wal-Mart, and Target became the four winners. Due to different reasons, their respective sales have increased, the number of sellers has increased, and the market share has also been expanding. Among them, Target has the fastest growth rate, but it's only invited seller base is difficult to compare with larger platforms.
Google Shopping, Wish and eBay performed poorly. eBay has achieved growth for two consecutive quarters, but it is unlikely to maintain this momentum. Because Wish relies on Chinese sellers, the delivery time is slow, and sales growth in the third quarter is also lagging behind. Google Shopping hasn’t made any obvious moves in trying to become an e-commerce channel. It remains a bystander, powering the ads at the top of the funnel.
Amazon Gross Merchandise Volume (GMV)
In 2020, sellers on Amazon sold $295 billion worth of goods, and as a retailer, Amazon's sales were $180 billion. According to the preliminary estimate disclosed by Amazon, the total merchandise turnover of Amazon this year is 475 billion US dollars.
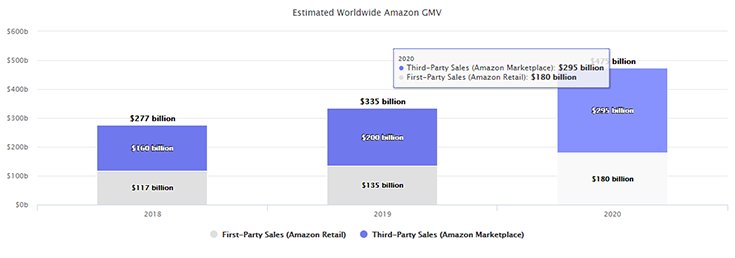
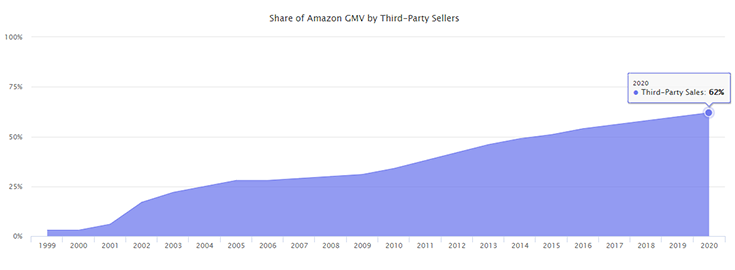
The sales of third-party sellers increased by 95 billion U.S. dollars in a year, up from 200 billion U.S. dollars in 2019. GMV increased by 42%, first-party sales increased by 35%, and third-party sales increased by 47%. 62% of Amazon's global GMV is determined by third-party platforms, which is higher than 60% in 2019 and 58% in 2018.
COVID Impact
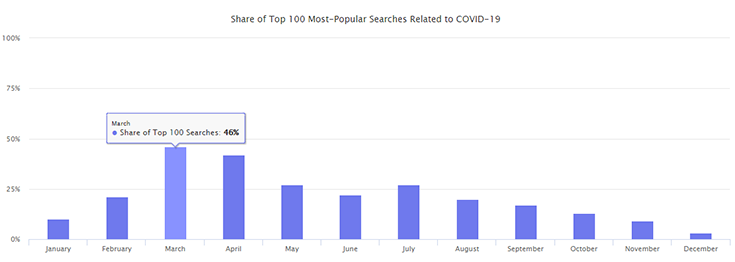
Demand for daily necessities such as toilet paper, hand sanitizer, paper towels, N95 masks and thermometers peaked in March. By the end of this year, the number of shoppers looking for these products had dropped significantly. In March of this year, 46% of the 100 most searched keywords on Amazon were related to "necessities." This figure dropped to only 3% in December.
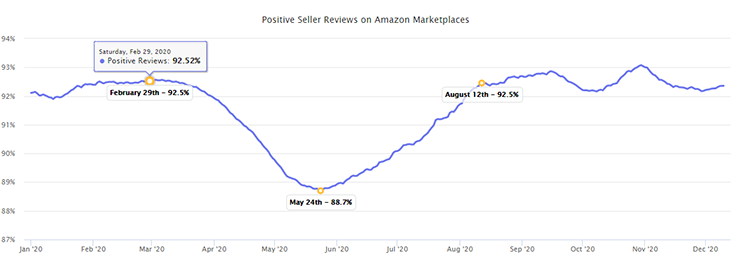
In May of this year, Amazon encountered the highest negative seller reviews in its history. Seller reviews are the best indicator of the mood of Amazon shoppers because they can collect up to 10 million reviews a month. In the 85 days from February 29 to May 24, the share of positive comments on Amazon's global site fell from 92.5% to 88.7%. Then, it took almost the same length of time to recover until August 12.
Consumers have more and more negative experiences, partly due to Amazon’s delivery difficulties, causing sellers to sell out the inventory of Amazon (FBA) operation centers, thereby reducing the types of products supported by Prime, the timeline of soaring negative reviews and enabling Prime The reduction of sellers matches. From the end of February to the beginning of August, sellers completed more sales than usual.
Small Sellers vs. Big Sellers
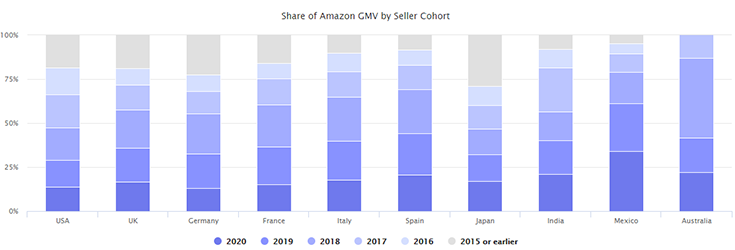
In the four largest markets (the United States, the United Kingdom, Germany and Japan), more than half of the sales are completed by sellers who joined in 2017 or earlier.
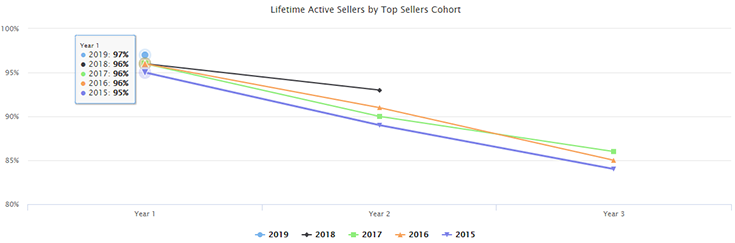
Active sellers usually stay for many years. For example, among the top 10,000 sellers in 2015, 84% of sellers were still active sellers in their third year on Amazon. 89% of Top sellers remained active after two years, and 95% of sellers remained active after one year. These percentages of Top sellers in 2015, 2016, 2017, 2018, and 2019 remain unchanged.
China Sellers
Since March, as the economy has resumed growth, more than half (more than 50%) of new sellers on Amazon in the US are from China. This compares to 36% in 2019. Every February, due to the Lunar New Year, the number of new sellers in China is the least.

Share the article


Sign Up for Shipping Solution Updates
Get weekly insights the logistics and fulfillment